Gini index of precipitation – new solution for drought detection?
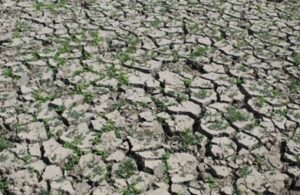
Rapid environmental changes cause extreme event to happen more and more often. One of them is a severe drought which have devastating impact on vegetation, wildlife, water management, farming and ultimately food availability. From year to year the interest in detection of such an event is increasing which raises the question – how to detect drought events?
In order to answer that question IBISA together with researcher from Eötvös Loránd University in Budapest Ghada Sahbeni performed research evaluating the usage of Gini index of precipitation for such a purpose.
Drought detection – state of art
Typical approach for drought detection with precipitation data is very straightforward – if in given period the amount of rainfall was smaller than X – there is a drought. But is it good? If we detected 300 mm of rain in one month it can mean both 30 days of 10 mm of precipitation or one day of 300 mm – and we can all agree that there is a huge difference between them.
In the first case we will have a very nice, moisture environment, perfect for growing most of the plants. In second case we will have 30 days of drought followed by massive rainfall causing flash flood, which just add more damage to already suffering farmers. It clearly shows that amount of rainfall is only one of the factors contributing to disastrous situation and other ones such as distribution of rainfall should not be neglected.
Shrank soil after dry period is not able to absorb much water which makes excessive rainfall causing even more problems.
The problem is very similar to one in economy – wealth evaluation among countries and citizens. At the beginning of 20 century the researches noticed that average income (or average wealth) is not a good indicator of living standard because it fails to distinguish between polarized and not polarized distribution of goods which is as important as quantitative median value of it. Among many propositions to address this issue one became very popular and is still used by economists worldwide – Gini index.
But what is Gini Index?
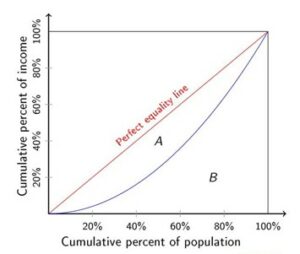
Gini index, also known as Gini coefficient was developed by Italian statistician Corrado Gini in early years of 20 century. It measures statistical dispersion and is mainly used to represent the income and wealth inequality within countries. The more equally distributed money in the society – the lower the value of Gini index.
Graphical explanation of the concept – if little people own most of money, the blue curve (which is Lorenz curve) bends downwards – increasing the distance from red line and therefore increasing Gini index value (that is equal to 2 times the surface A)
So here comes the idea – what if instead of measuring the amount or rainfall we measure the distribution of it with Gini index? In order to assess this, we had chosen 5 locations in Europe and listed all the major drought since 1980 according to Global Drought Observatory. For every location precipitation data (ERA5) was processed, Gini index of yearly precipitation was calculated and plotted and the conclusions were drawn basing on this comparison.
Major drought events in Europe between 1980 and 2016
Major European drought events since 1980 and associated Gini index peaks. Correlation between the peaks and events is easily observable.
Conclusions
In the research it was concluded that the Gini index shows a high synchrony with drought events – which makes it considerable when it comes to choosing drought detection tool for various applications including parametric insurance, scientific researches, agriculture and breeding, water management (surface and ground water), industry and many more.
The detailedresearch can be accessed on Royal Meteorological Society’s library (RMetS) via this link HERE.
This website uses cookies to improve your experience. We'll assume you're ok with this, but you can opt-out if you wish. Cookie settingsACCEPT
Privacy & Cookies Policy
Privacy Overview
This website uses cookies to improve your experience while you navigate through the website. Out of these cookies, the cookies that are categorized as necessary are stored on your browser as they are essential for the working of basic functionalities of the website. We also use third-party cookies that help us analyze and understand how you use this website. These cookies will be stored in your browser only with your consent. You also have the option to opt-out of these cookies. But opting out of some of these cookies may have an effect on your browsing experience.
Necessary cookies are absolutely essential for the website to function properly. This category only includes cookies that ensures basic functionalities and security features of the website. These cookies do not store any personal information.
Any cookies that may not be particularly necessary for the website to function and is used specifically to collect user personal data via analytics, ads, other embedded contents are termed as non-necessary cookies. It is mandatory to procure user consent prior to running these cookies on your website.